22 KiB
nf-core/taxprofiler: Output
Introduction
This document describes the output produced by the pipeline. Most of the plots are taken from the MultiQC report, which summarises results at the end of the pipeline.
The directories listed below will be created in the results directory after the pipeline has finished. All paths are relative to the top-level results directory.
Pipeline overview
The pipeline is built using Nextflow and processes data using the following steps:
- FastQC - Raw read QC
- falco - Alternative to FastQC for raw read QC
- fastp - Adapter trimming for Illumina data
- AdapterRemoval - Adapter trimming for Illumina data
- Porechop - Adapter removal for Oxford Nanopore data
- BBDuk - Quality trimming and filtering for Illumina data
- PRINSEQ++ - Quality trimming and filtering for Illunina data
- Filtlong - Quality trimming and filtering for Nanopore data
- Bowtie2 - Host removal for Illumina reads
- minimap2 - Host removal for Nanopore reads
- samtoolsstats - Statistics from host removal
- Bracken - Taxonomic classifier using k-mers and abundance estimations
- Kraken2 - Taxonomic classifier using exact k-mer matches
- KrakenUniq - Taxonomic classifier that combines the k-mer-based classification and the number of unique k-mers found in each species
- Centrifuge - Taxonomic classifier that uses a novel indexing scheme based on the Burrows-Wheeler transform (BWT) and the Ferragina-Manzini (FM) index.
- Kaiju - Taxonomic classifier that finds maximum (in-)exact matches on the protein-level.
- Diamond - Sequence aligner for protein and translated DNA searches.
- MALT - Sequence alignment and analysis tool designed for processing high-throughput sequencing data, especially in the context of metagenomics
- MetaPhlAn3 - Genome-level marker gene based taxonomic classifier
- mOTUs - Tool for marker gene-based OTU (mOTU) profiling.
- MultiQC - Aggregate report describing results and QC from the whole pipeline
- Pipeline information - Report metrics generated during the workflow execution
FastQC
Output files
fastqc/*_fastqc.html: FastQC report containing quality metrics.*_fastqc.zip: Zip archive containing the FastQC report, tab-delimited data file and plot images.
FastQC gives general quality metrics about your sequenced reads. It provides information about the quality score distribution across your reads, per base sequence content (%A/T/G/C), adapter contamination and overrepresented sequences. For further reading and documentation see the FastQC help pages.
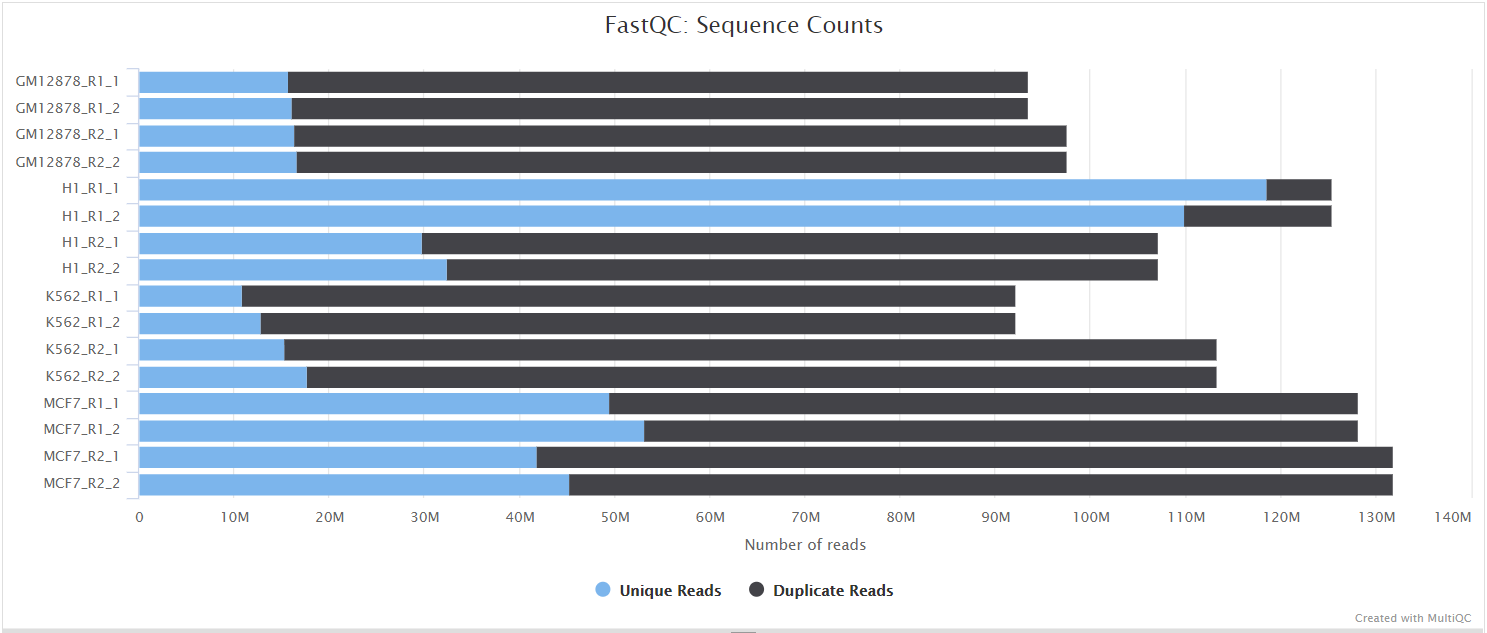
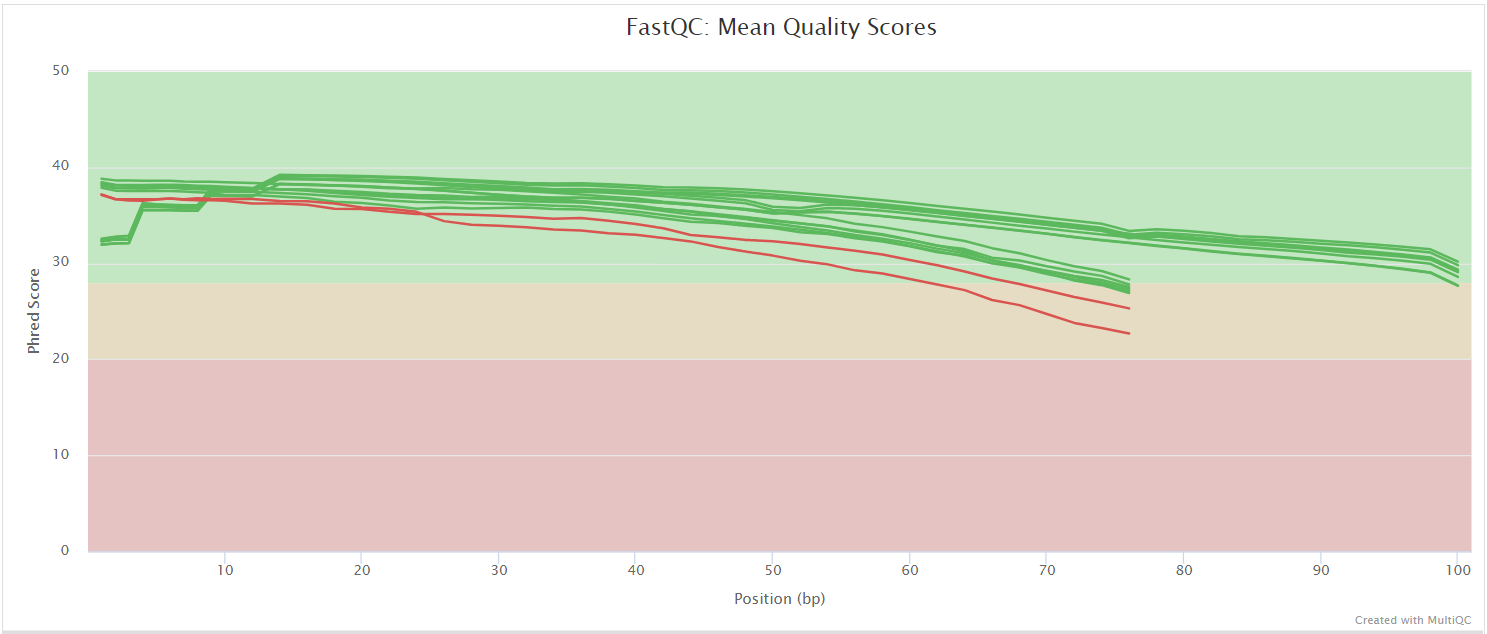
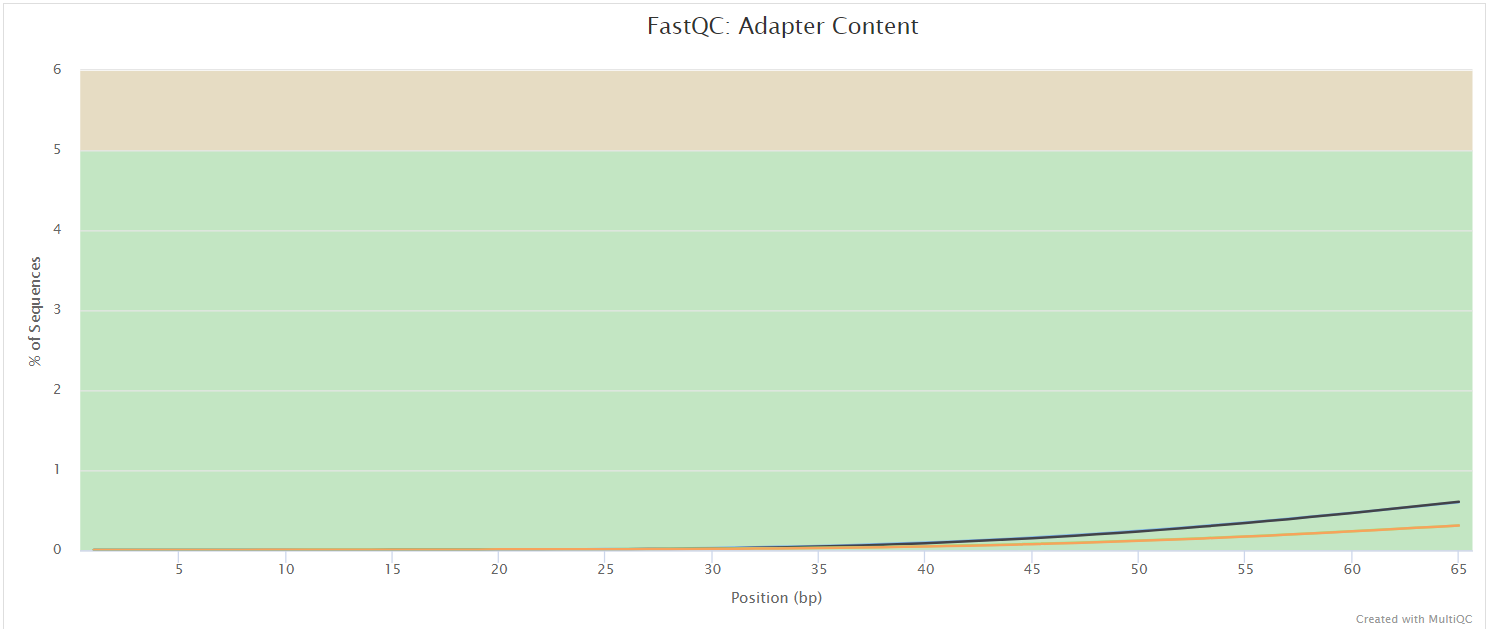
NB: The FastQC plots displayed in the MultiQC report shows untrimmed reads. They may contain adapter sequence and potentially regions with low quality.
fastp
fastp can automatically detect adapter sequences for Illumina data.
Output files
fastp<sample_id>.fastp.fastq.gz: File with the trimmed unmerged fastq reads.<sample_id>.merged.fastq.gz: File with the reads that were successfully merged.
AdapterRemoval
AdapterRemoval searches for and removes remnant adapter sequences from High-Throughput Sequencing (HTS) data and (optionally) trims low quality bases from the 3' end of reads following adapter removal. It is popular in the field of palaeogenomics. The output logs are stored in the results folder, and as a part of the MultiQC report.
Output files
adapterremoval/<sample_id>.settings: AdapterRemoval log file containing general adapter removal, read trimming and merging statistics<sample_id>.collapsed.fastq.gz- read-pairs that merged and did not undergo trimming (only when--shortread_qc_mergepairssupplied)<sample_id>.collapsed.truncated.fastq.gz- read-pairs that merged underwent quality trimming (only when--shortread_qc_mergepairssupplied)<sample_id>.pair1.truncated.fastq.gz- read 1 of pairs that underwent quality trimming<sample_id>.pair2.truncated.fastq.gz- read 2 of pairs that underwent quality trimming (and could not merge if--shortread_qc_mergepairssupplied)<sample_id>.singleton.truncated.fastq.gz- orphaned read pairs where one of the pair was discarded<sample_id>.discard.fastq.gz- reads that were discarded due to length or quality filtering
By default nf-core/taxprofiler will only provide the .settings file if AdapterRemoval is selected. You will only find the FASTQ files in the results directory if you provide --save_preprocessed_reads . If this is selected, you may recieve different combinations of FASTQ files for each sample depending on the input types - e.g. whether you have merged or not, or if you're supplying both single- and paired-end reads.
Note that the FASTQ files may not always be the 'final' reads that go into taxprofiling, if you also run other steps such as complexity filtering, host removal, run merging etc..
Porechop
Output files
porechop<sample_id>.fastq.gz: Adapter-trimmed file
BBDuk
BBDuk stands for Decontamination Using Kmers. BBDuk was developed to combine most common data-quality-related trimming, filtering, and masking operations into a single high-performance tool.
It is used in nf-core/taxprofiler for complexity filtering using different algorithms. This means that it will remove reads with low sequence diversity (e.g. mono- or dinucleotide repeats).
Output files
bbduk/<sample_id>.bbduk.log: log file containing filtering statistics<sample_id>.fastq.gz: resulting FASTQ file without low-complexity reads
By default nf-core/taxprofiler will only provide the .log file if BBDuk is selected as the complexity filtering tool. You will only find the complexity filtered reads in your results directory if you provide --save_complexityfiltered_reads .
Note that the FASTQ file(s) may not always be the 'final' reads that go into taxprofiling, if you also run other steps such as host removal, run merging etc..
PRINSEQ++
PRINSEQ++ is a C++ implementation of the prinseq-lite.pl program. It can be used to filter, reformat or trim genomic and metagenomic sequence data.
It is used in nf-core/taxprofiler for complexity filtering using different algorithms. This means that it will remove reads with low sequence diversity (e.g. mono- or dinucleotide repeats).
Output files
prinseqplusplus/<sample_id>.log: log file containing number of reads. Row IDs correspond to:min_len, max_len, min_gc, max_gc, min_qual_score, min_qual_mean, ns_max_n, noiupac, derep, lc_entropy, lc_dust, trim_tail_left, trim_tail_right, trim_qual_left, trim_qual_right, trim_left, trim_right<sample_id>_good_out.fastq.gz: resulting FASTQ file without low-complexity reads
By default nf-core/taxprofiler will only provide the .log file if PRINSEQ++ is selected as the complexity filtering tool. You will only find the complexity filtered FASTQ files in your results directory if you supply --save_complexityfiltered_reads .
Note that the FASTQ file(s) may not always be the 'final' reads that go into taxprofiling, if you also run other steps such as host removal, run merging etc..
Filtlong
Output files
filtlong<sample_id>_filtered.fastq.gz: Quality or short read data filtered file<sample_id>_filtered.log: log file containing summary statistics
Bowtie2
Bowtie 2 is an ultrafast and memory-efficient tool for aligning sequencing reads to long reference sequences. It is particularly good at aligning reads of about 50 up to 100s or 1,000s of characters, and particularly good at aligning to relatively long (e.g. mammalian) genomes.
It is used with nf-core/taxprofiler to allow removal of 'host' (e.g. human) or other possible contaminant reads (e.g. Phi X) from the FASTQ files prior to profiling.
Output files
bowtie2/<sample_id>.bam: reads that aligned against the user-supplied reference genome<sample_id>.bowtie2.log: log file about the mapped reads<sample_id>.unmapped.fastq.gz: the off-target reads from the mapping that is used in downstream steps.
By default nf-core/taxprofiler will only provide the .log file if host removal is turned on. You will only see the mapped (host) reads BAM file or the off-target reads in FASTQ format in your results directory if you provide --save_hostremoval_mapped and --save_hostremoval_unmapped respectively.
Note that the FASTQ file(s) may not always be the 'final' reads that go into taxprofiling, if you also run other steps such as host removal, run merging etc..
minimap2
Output files
minimap2<sample_id>.bam: Alignment file in bam format
Samtools stats
Output files
samtoolsstats<sample_id>.stats: File containing samtools stats output
Bracken
Bracken (Bayesian Reestimation of Abundance with KrakEN) is a highly accurate statistical method that computes the abundance of species in DNA sequences from a metagenomics sample. Braken uses the taxonomy labels assigned by Kraken, a highly accurate metagenomics classification algorithm, to estimate the number of reads originating from each species present in a sample.
🛈 The first step of using Bracken requires running Kraken2, therefore the initial results before abundance estimation will be found in
<your_results>/kraken2/<your_bracken_db_name>.
Output files
bracken/bracken_<db_name>_combined_reports.txt: combined bracken results as output from Bracken'scombine_bracken_outputs.pyscript<db_name>/<sample>_<db_name>.tsv: TSV file containing per-sample summary of Bracken results with abundance information
The main taxonomic profiling file from Bracken is the *.tsv file. This provides the basic results from Kraken2 but with the corrected abundance information.
Kraken2
Kraken is a taxonomic sequence classifier that assigns taxonomic labels to DNA sequences. Kraken examines the k-mers within a query sequence and uses the information within those k-mers to query a database. That database maps -mers to the lowest common ancestor (LCA) of all genomes known to contain a given k-mer.
Output files
kraken2/<db_name>_combined_reports.txt: A combined profile of all samples aligned to a given database (as generated bykrakentools)<db_name>/<sample_id>_<db_name>.classified.fastq.gz: FASTQ file containing all reads that had a hit against a reference in the database for a given sample<sample_id>_<db_name>.unclassified.fastq.gz: FASTQ file containing all reads that did not have a hit in the database for a given sample<sample_id>_<db_name>.report.txt: A Kraken2 report that summarises the fraction abundance, taxonomic ID, number of Kmers, taxonomic path of all the hits in the Kraken2 run for a given sample<sample_id>_<db_name>.classifiedreads.txt: A list of read IDs and the hits each read had against each database for a given sample
The main taxonomic profiling file from Kraken2 is the _combined_reports.txt or *report.txt file. The former provides you the broadest over view of the taxonomic profiling results across all samples against a single databse, where you get two columns for each sample e.g. 2_all and 2_lvl, as well as a summarised column summing up across all samples tot_all and tot_lvl. The latter gives you the most information for a single sample. The report file is also used for the taxpasta step.
You will only recieve the FASTQs and *classifiedreads.txt file if you supply --kraken2_save_reads and/or --kraken2_save_readclassification parameters to the pipeline.
KrakenUniq
KrakenUniq (formerly KrakenHLL) is an extenson to the fast k-mer-based classification Kraken with an efficient algorithm for additionally assessing the coverage of unique k-mers found in each species in a dataset.
Output files
krakenuniq/<db_name>/<sample_id>_<db_name>.classified.fastq.gz: FASTQ file containing all reads that had a hit against a reference in the database for a given sample<sample_id>_<db_name>.unclassified.fastq.gz: FASTQ file containing all reads that did not have a hit in the database for a given sample<sample_id>_<db_name>.report.txt: A Kraken2-style report that summarises the fraction abundance, taxonomic ID, number of Kmers, taxonomic path of all the hits, with an additional column for k-mer coverage, that allows for more accurate distinguishing between false-positive/true-postitive hits<sample_id>_<db_name>.classifiedreads.txt: A list of read IDs and the hits each read had against each database for a given sample
The main taxonomic profiling file from KrakenUniq is the *report.txt file. This is an extension of the Kraken2 report with the additional k-mer coverage information that provides more information about the accuracy of hits.
⚠️ The output system of KrakenUniq can result in other
stdoutorstderrlogging information being saved in the report file, therefore you must check your report files before downstream use!
You will only receive the FASTQs and *classifiedreads.txt file if you supply --krakenuniq_save_reads and/or --krakenuniq_save_readclassification parameters to the pipeline.
Centrifuge
Output files
centrifuge<sample_id>.centrifuge.mapped.fastq.gz: Fastq files containing all mapped reads<sample_id>.centrifuge.report.txt: A classification report that summarises the taxonomic ID, the taxonomic rank, length of genome sequence, number of classified and uniquely classified reads<sample_id>.centrifuge.results.txt: A file that summarises the classification assignment for a read, i.e read ID, sequence ID, score for the classification, score for the next best classification, number of classifications for this read<sample_id>.centrifuge.txt: A Kraken2-style report that summarises the fraction abundance, taxonomic ID, number of k-mers, taxonomic path of all the hits in the centrifuge run for a given sample<sample_id>.centrifuge.unmapped.fastq.gz: Fastq file containing all unmapped reads
Kaiju
Output files
kaiju<sample_id>.tsv: A file that summarises the fraction abundance, taxonomic ID, number of reads and taxonomic nameskaiju_<db_name>_combined_reports.txt: A combined profile of all samples aligned to a given database (as generated bykaiju2table)
DIAMOND
Output files
diamond<sample_id>.log: A log file containing stdout information<sample_id>.sam: A file in SAM format that contains the aligned reads
MALT
MALT is a fast replacement for BLASTX, BLASTP and BLASTN, and provides both local and semi-global alignment capabilities.
Output files
malt/<db_name>/<sample_id>.blastn.sam: sparse SAM file containing alignments of each hit<sample_id>.megan: summary file that can be loaded into the MEGAN6 interactive viewer. Generated by MEGAN6 companion toolrma2info<sample_id>.rma6: binary file containing all alignments and taxonomic information of hits that can be loaded into the MEGAN6 interactive viewer<sample_id>.txt.gz: text file containing taxonomic IDs and read counts against each taxon. Generated by MEGAN6 companion toolrma2info
The main output of MALT is the .rma6 file format, which can be only loaded into MEGAN and it's related tools. We provide the rma2info text files for improved compatibility with spreadsheet programs and other programmtic data manipulation tools, however this has only limited information compared to the 'binary' RMA6 file format (the txt file only contains taxonomic ID and count, whereas RMA6 has taxonomic lineage information).
You will only recieve the .sam and .megan files if you supply --malt_save_reads and/or --malt_generate_megansummary parameters to the pipeline.
MetaPhlAn3
MetaPhlAn3 is a computational tool for profiling the composition of microbial communities (Bacteria, Archaea and Eukaryotes) from metagenomic shotgun sequencing data (i.e. not 16S) with species-level resolution via marker genes.
Output files
metaphlan3/metaphlan3_<db_name>_combined_reports.txt: A combined profile of all samples aligned to a given database (as generated bymetaphlan_merge_tables)<db_name>/<sample_id>.biom: taxonomic profile in BIOM format<sample_id>.bowtie2out.txt: BowTie2 alignment information (can be re-used for skipping alignment when re-running MetaPhlAn3 with different parameters)<sample_id>_profile.txt: MetaPhlAn3 taxonomic profile including abundance estimates
The main taxonomic profiling file from MetaPhlAn3 is the *_profile.txt file. This provides the abundance estimates from MetaPhlAn3 however does not include raw counts by default.
mOTUs
Output files
motus<sample_id>.log: A log file that contains summary statistics<sample_id>.out: A classification file that summarises taxonomic identifiers, by default at the rank of mOTUs (i.e., species level), and their relative abundances in the profiled sample.motus_<db_name>_combined_reports.txt: A combined profile of all samples aligned to a given database (as generated bymotus_merge)
Krona is Krona allows the exploration of (metagenomic) hierarchical data with interactive zooming, multi-layered pie charts.
Krona charts will be generated by the pipeline for supported tools (Kraken2, Centrifuge, Kaiju, and MALT)
Output files
krona/<tool_name>_<db_name>.html: per-tool/per-database interactive HTML file containing hierarchical piecharts
The resulting HTML files can be loaded into your web browser for exploration. Each file will have a dropdown to allow you to switch between each sample aligned against the given database of the tool.
MultiQC
Output files
multiqc/multiqc_report.html: a standalone HTML file that can be viewed in your web browser.multiqc_data/: directory containing parsed statistics from the different tools used in the pipeline.multiqc_plots/: directory containing static images from the report in various formats.
MultiQC is a visualization tool that generates a single HTML report summarising all samples in your project. Most of the pipeline QC results are visualised in the report and further statistics are available in the report data directory.
Results generated by MultiQC collate pipeline QC from supported tools e.g. FastQC. The pipeline has special steps which also allow the software versions to be reported in the MultiQC output for future traceability. For more information about how to use MultiQC reports, see http://multiqc.info.
Pipeline information
Output files
pipeline_info/- Reports generated by Nextflow:
execution_report.html,execution_timeline.html,execution_trace.txtandpipeline_dag.dot/pipeline_dag.svg. - Reports generated by the pipeline:
pipeline_report.html,pipeline_report.txtandsoftware_versions.yml. Thepipeline_report*files will only be present if the--email/--email_on_failparameter's are used when running the pipeline. - Reformatted samplesheet files used as input to the pipeline:
samplesheet.valid.csv.
- Reports generated by Nextflow:
Nextflow provides excellent functionality for generating various reports relevant to the running and execution of the pipeline. This will allow you to troubleshoot errors with the running of the pipeline, and also provide you with other information such as launch commands, run times and resource usage.